sceewv
SCEEWV
sceewv is a tool to check, evaluate and analyze the performance of the Early Warning System. It reads information from the SeisComP system, store critical parameters in JSON databases, and creates dashboards that allow checking the performance interactively
SeisComp Module
sceewv reads event information including preferred and non-preferred origins to create databases with the required information to check the early warning performance. sceewv also stores acceleration envelope values using the sceewenv module, store this information in a database and use it to produce products that allow a fast evaluation of the seismic data for specific earthquakes.
This module can be used in two ways:
Real-time: sceewv connects directly with the messaging system and listens for new/updated/removed objects related to early warning processing.
Command-line: sceewv queries the SeisComP database for a specific period looking for all required information to update the dashboard.
To read and compute events information:
$sceewv -u usr --query --start "%Y-%m-%d %H:%M:%S" --end "%Y-%m-%d
%H:%M:%S" --debug
To compute envelope information:
$sceewv -u usr --envelope --envstart "%Y-%m-%d %H:%M:%S" --endstart
"%Y-%m-%d %H:%M:%S" --debugcode
JSON Databases
All data is stored in two JSON databases stored by default in the default DATADIR of SeisComP.
The first database includes all information related to Events, Origins, Picks and Magnitudes and is organized following the next structure:
@DATADIR/events/year/month/day/eventID
The second database includes acceleration envelope information for each station sorted by distance to the epicenter. This database is organized following the next structure:
DATADIR@/event/year/month/day/eventID
Files are stored in JSON format.
Events Dashboard
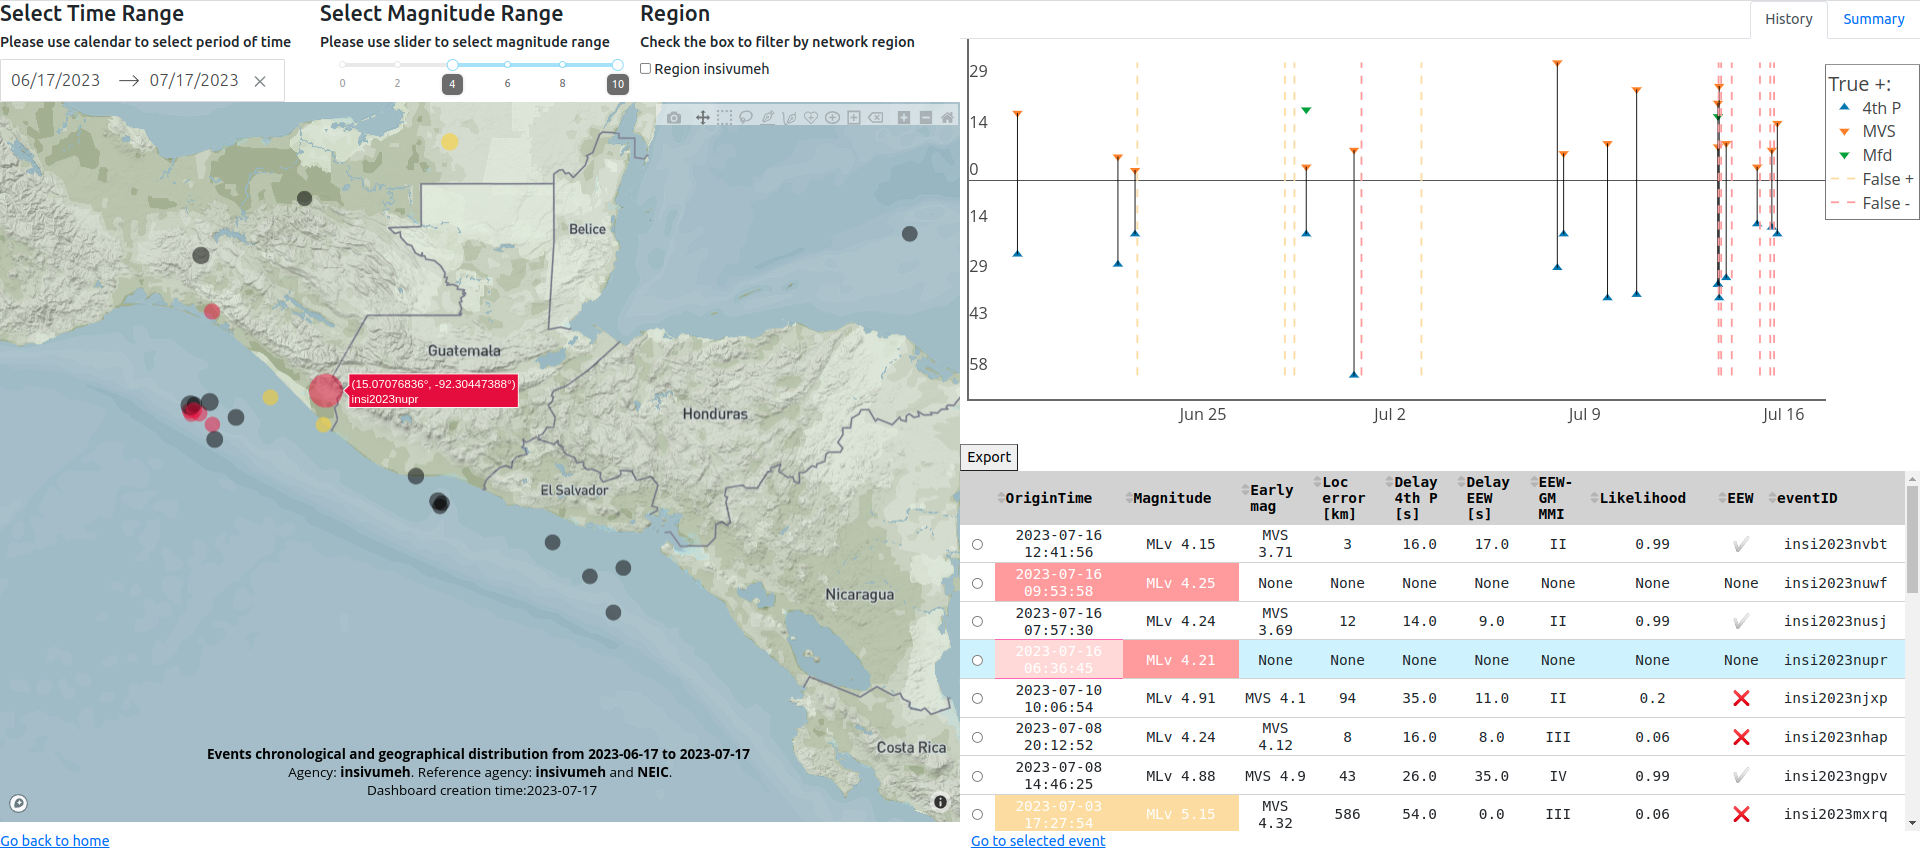
This dashboard includes the information stored in the events database and allows control quality of early warning results for a particular selection of events.
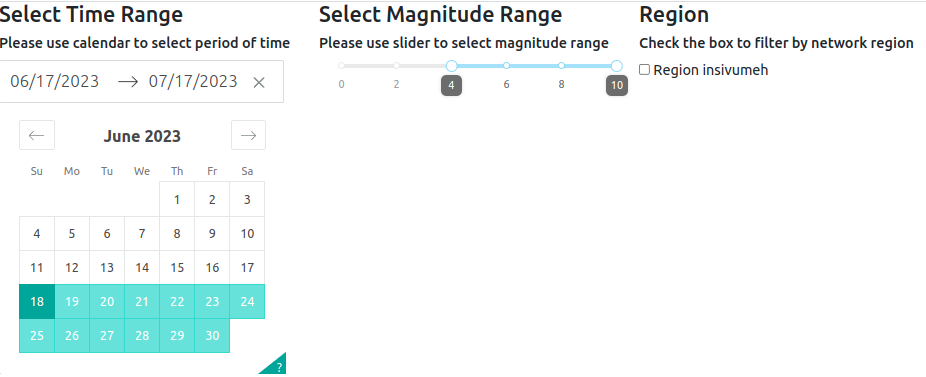
To use this application, you must select the events to analyze. To select events, you must: * Use drop-down menus at the top of the map on the left side to choose the period * Use the slider at the top of the map in the middle to choose the magnitude range. * Restrict the area to your interest region (configurable) using the check box at the top of the map on the right side.
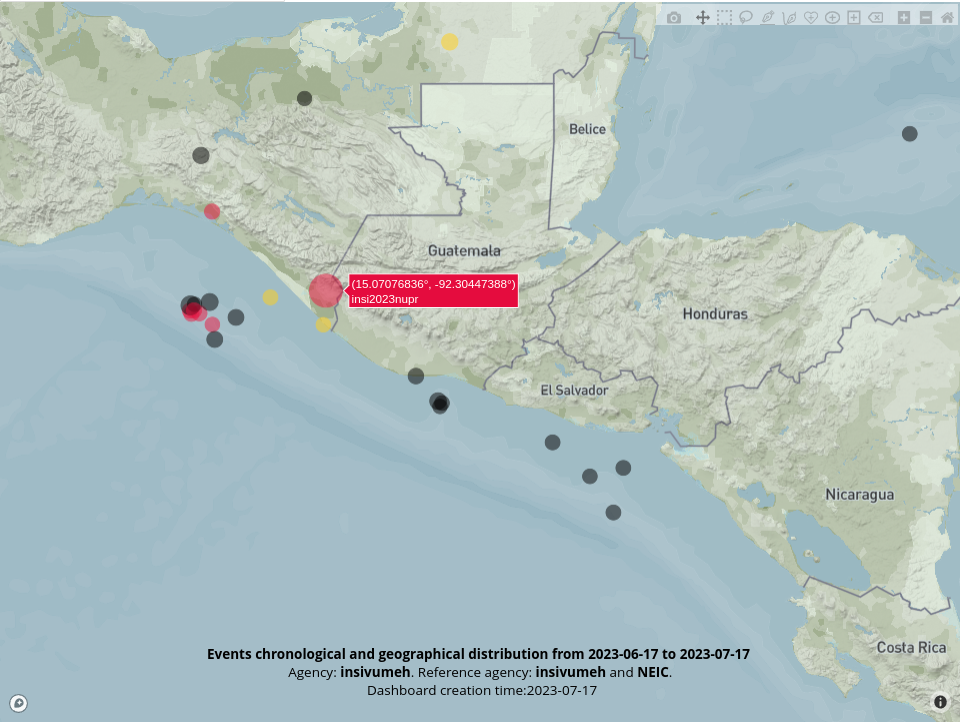
The map on the left side shows the selected events. The map shows events as circles. The event selected in the table is displayed with the biggest circle, and you can select an event if you click an event on the map. Circles could have three colors: black for true positives, yellow for false positives, and green for false negatives. At the bottom of the map, some relevant information is displayed. The map is interactive. It allows you to change the zoom (using the scroll) and to move the area (holding the left click). More interaction options could be activated using the menu in the upper right corner. Hovering the pointer over each circle on the map displays information (configurable) related to the event.
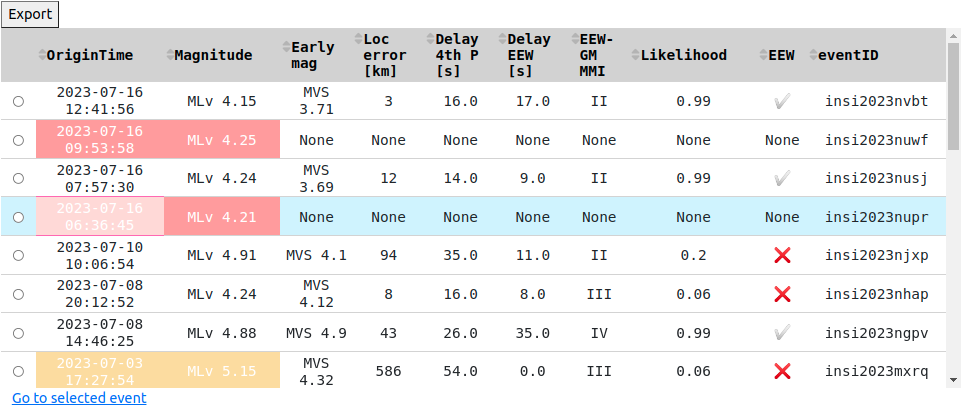
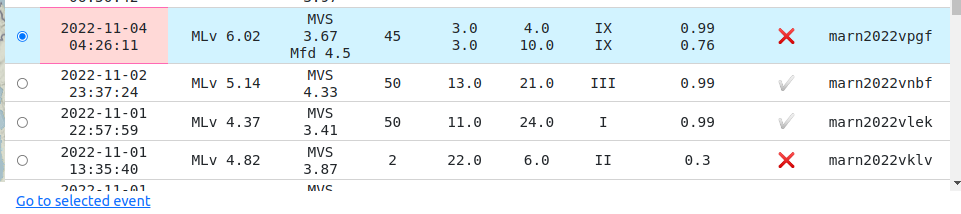
The table with selected events is shown in the lower part of the right side of the events dashboard. The first two columns display information for the preferred origin. These columns could have a background color; yellow in case of a false positive, red in case of a false negative, or white for true positive events. Information regarding early warning solutions is shown from the third to the eighth column. The ninth column, called “EEW” indicates whether or not this information was sent to the early warning dissemination system such as EEWD, EEWBS, or the mobile application. The event selected in the table will be shown with a blue background and highlighted on the map (the biggest circle). Information can be sorted in descending order or ascending using the values of any column. The selection circle on the left side of each event allows you to select a single event to be analyzed with the event dashboard by pressing the link ”Go to selected event”.
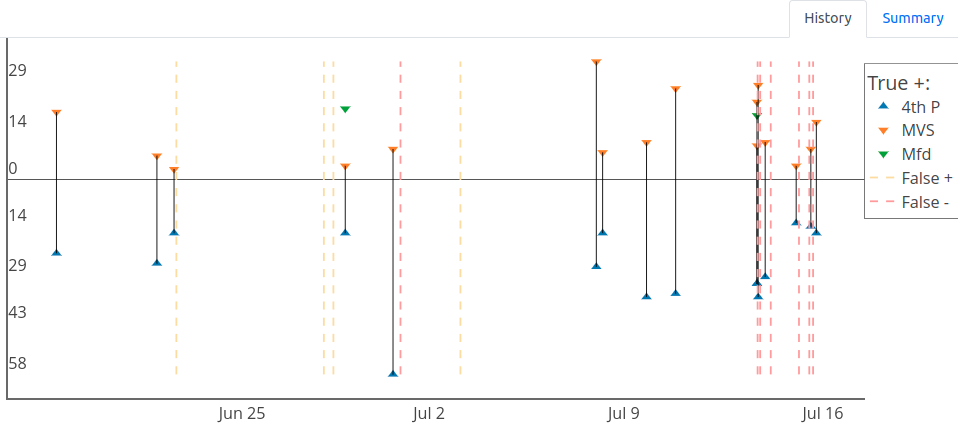
In the upper part of the right side, you can select History to show the graph of delays for selected events. This plot shows in colored triangles the delay value corresponding to the arrival of the first 4 phases (4th P) and the computation times for the previously configured types of magnitudes. A black line connects the delays of one event. The The 4th P delay is plotted below the zero line, but these are positive values. The yellow and red dotted lines show the false positives and false negatives. This graph is interactive. It allows you to modify the zoom (by selecting an area with the left click). Interaction options could be activated by hovering over the upper right corner. Data series can be deactivated or activated by pressing the name in the legend.
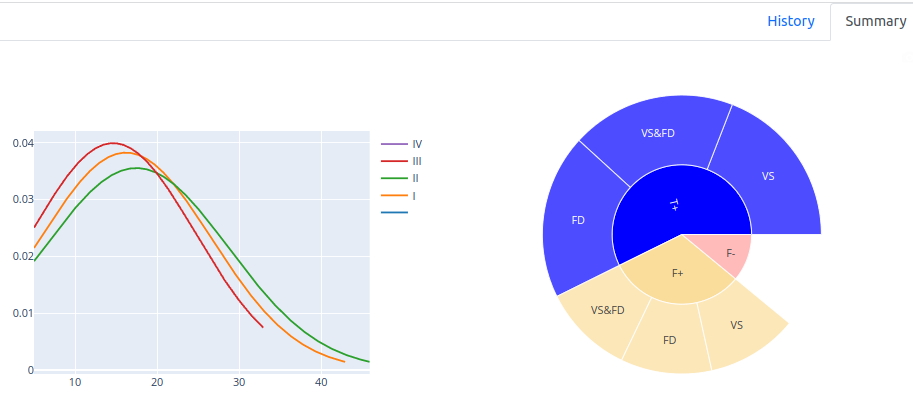
At the top of the right side, you can select summary to display two graphs. On the left, is the histogram of delays in seconds for each intensity value. Intensities can be activated or deactivated by clicking on the legend. On the right, the plot shows the number of events T+, F+, and F- of the selected events. Clicking on the categories T+ and F+ modifies the graph showing the number of events with FinDer, VS, or FinDer and VS for the selected category. Hovering the pointer over any classification will show the corresponding number of events.
Event Dashboard
This dashboard includes the information stored in the event database and allows control quality of early warning results for a particular event:
Events and event dashboards are all linked. To open the event dashboard from the events dashboard uses the white circle on the left of the table and pass the link at the bottom of the table called “Go to selected event”:
Dropdown menus to select EEW solutions and stations:
Dropdown menu on the left with early warning solutions for the selected event. It is possible to select any solution that will modify the map, envelope plot, and performance plots content according to the selected solution.
Dropdown menu on the right with two options, “all” and “used,” means select all available stations or stations used by the chosen solution in the side dropdown menu. The map and envelope plot content will change according to the selected option.
- Using the data stored in the events and event JSON databases, the
dashboard displays a map with all the early warning solutions:
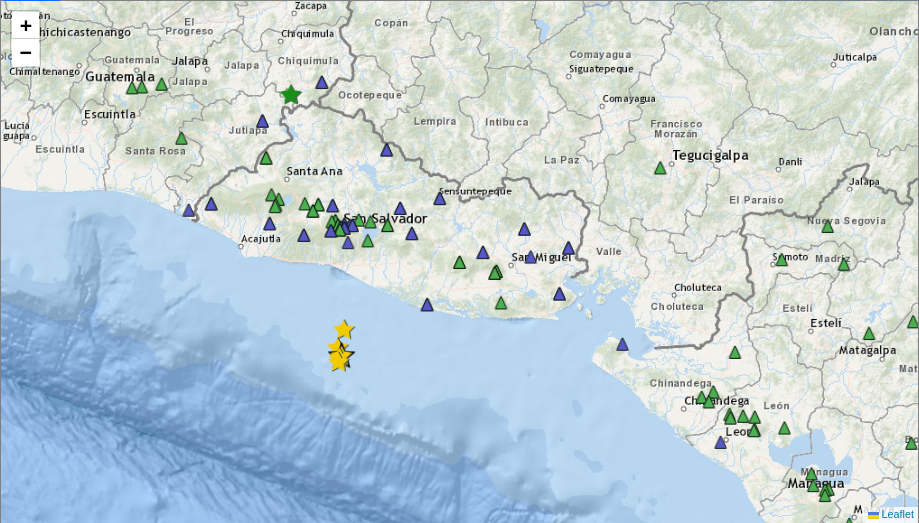
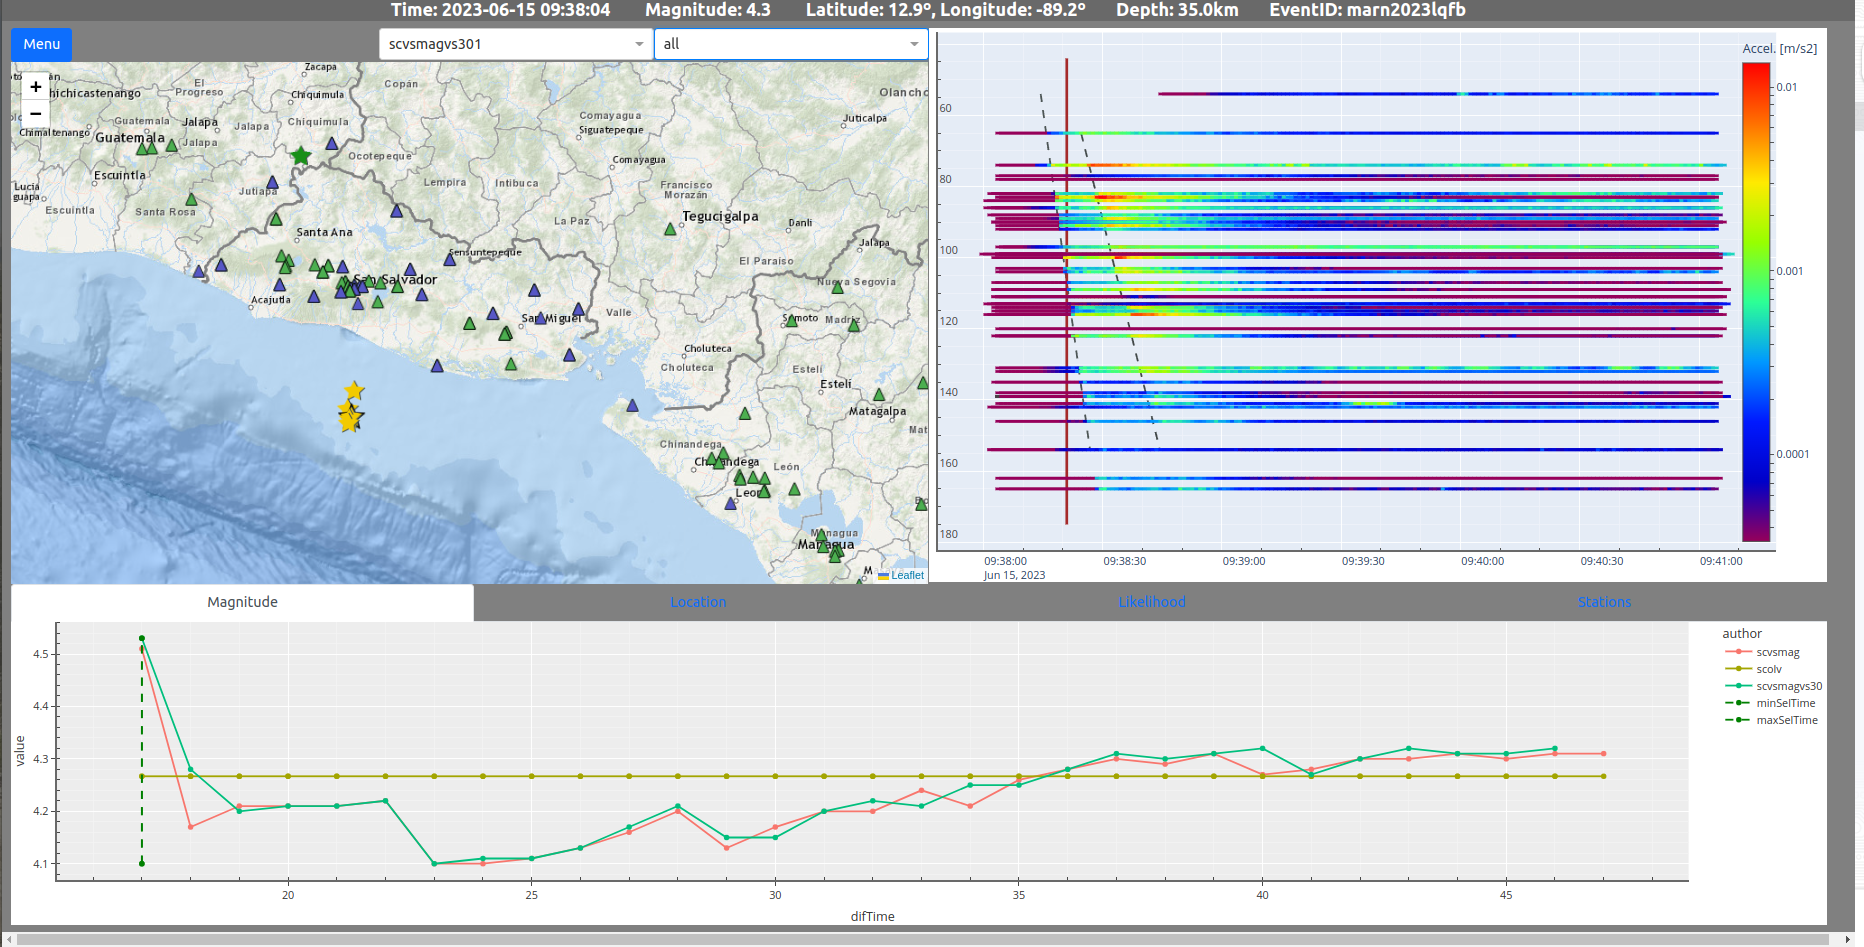
Below is a description for each object on the map:
The stars represent the different locations. The black star is the preferred origin location, the yellow ones are all the locations associated with early warning solutions, and the green star symbolizes the EEW solution selected in the left dropdown menu at the top of the map.
The green circles with dashed lines show fixed values of delay between the time of computing the selected early warning solution and the time the S phase takes to arrive.
The green circles with solid lines represent intensity values reached for the selected early warning solution.
The black circles with dashed lines represent some fixed values of delay between the computing time of the preferred solution and the time the S phase takes to arrive.
The solid black circles represent intensity values achieved for the selected preferred solution.
The purple triangles show the location of the stations with accelerometers.
The green triangles show the location of stations with equipment other than accelerometers.
Envelopes of acceleration are shown in a graph of distance versus time:
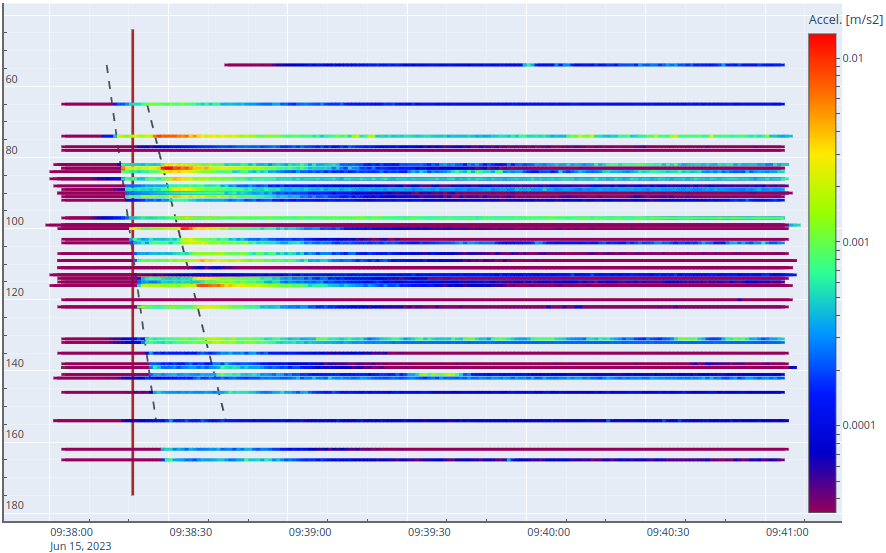
This graph shows a line for each station. On the Y axis the epicentral distances of the stations, and on the X axis, the UTC time. In colors, the acceleration values are presented in m/s2. The red vertical line shows the time of the selected early warning solution. In addition, the arrivals of the direct and refracted P and S waves are shown in gray dotted lines.
The main objectives of this graph are:
Compare the time of the EEW solution with the theoretical and real arrival of the P and S waves.
To check the value of the accelerations measured at each station and the variation of acceleration for the same station according to the different arrivals of seismic waves.
Distribution regarding the hypocentral distance of the stations selected in the dropdown at the top of the map.
See other effects, such as energy attenuation increasing the hypocentral distance.
Using the parametric data stored in the events database, the dashboard shows several graphs to monitor some important parameters computed during the process of locating and estimating the magnitudes by the early warning system:
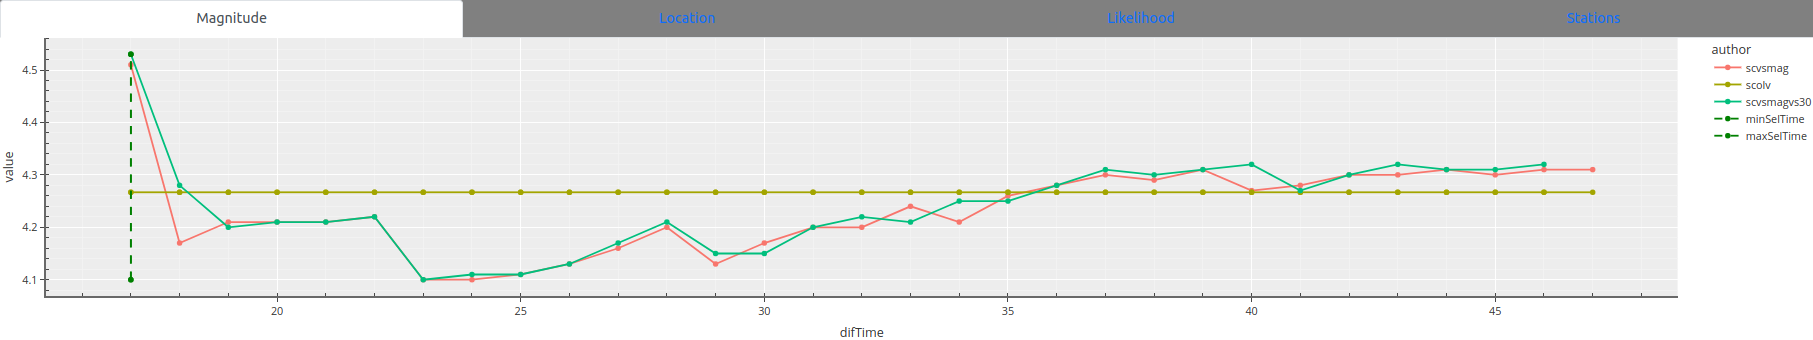
The dashboard has four quality control diagrams:
Magnitude: Shows the values of each type of early warning magnitude. It also displays the preferred magnitude value as a reference value.
Location: Shows the differences in km of the locations associated with EEW magnitudes versus preferred location.
Likelihood: Shows the likelihood values for each type of early warning magnitude.
Stations: The number of stations used to compute locations associated with early warning magnitude types. It also presents the number of stations used for the preferred location as a reference value.
The green vertical lines in all diagrams indicate the values related to the EEW selected solution in the dropdown on the top of the map.
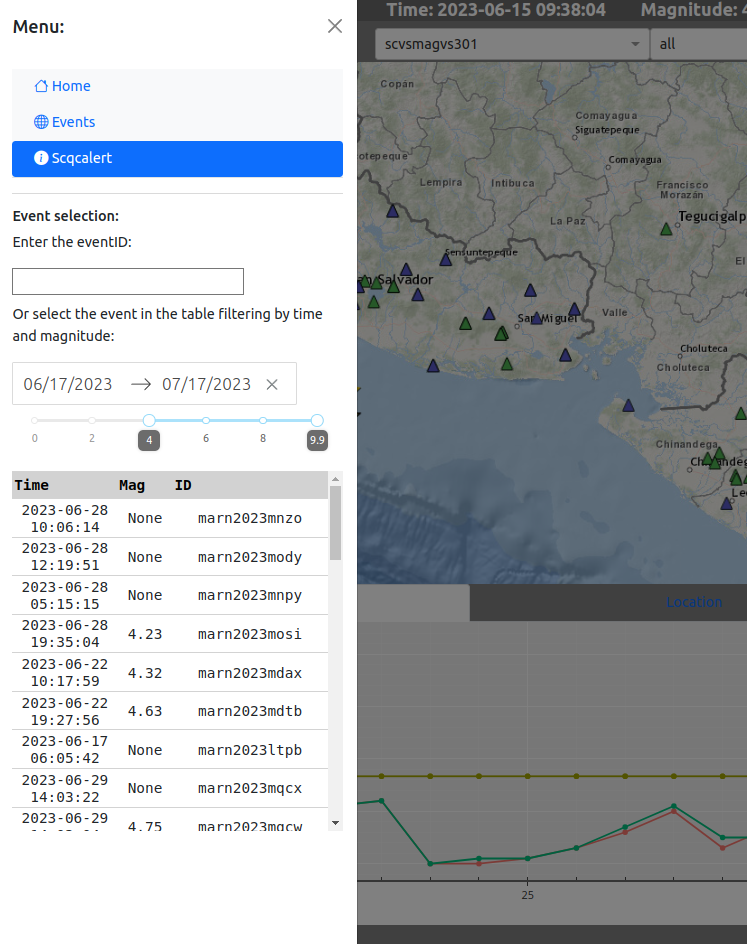
In the top right corner, the button labeled menu unfolds a hidden side menu with links to the index and other dashboards. Below are options to select the event using the eventID or look for the event using the time and magnitude range.
Configuration
etc/defaults/global.cfgetc/defaults/sceewv.cfgetc/global.cfgetc/sceewv.cfg~/.seiscomp/global.cfg~/.seiscomp/sceewv.cfgsceewv inherits global options.
- postProcFreq
Type: int
Interval in minutes to compute envelopes and update events JSON database Default is
60.
- APPSpath
Type: path
Path to save/update config for all apps Default is
@DATADIR@/sceewv/.
- JSONpath
Type: path
Path to save JSON database Default is
@DATADIR@/sceewv/events/.
- fdTypes
Type: list:String
Types of magnitude FinDer allowed Default is
[Mfd,Mfdr,Mfdl].
- alert
Type: bool
If scqcalert dashboard available. alertpath required Default is
True.
- alertpath
Type: path
Path to scqcalert dashboard Default is
@DATADIR@/sceewv/.
- host
Type: String
Bind address of the server. "0.0.0.0" allows any interface to conect to this server Default is
0.0.0.0.
- port
Type: String
Server port Default is
8050.
- mapboxtoken
Type: path
App key to use custom maps with mapbox Default is
@DATADIR@/sceewv/mapbox_token.
- extquery
Type: bool
Use external catalog to evaluate events Default is
True.
- fdsnwsname
Type: String
fdsnws service name to use for external catalog Default is
NEIC.
- agency
Type: String
Agency name Default is
OVSICORI-UNA.
- fdsnwsclient
Type: String
Route to fdsnws service Default is
https://earthquake.usgs.gov/.
- deltatime
Type: int
Delta time in minutes to compare events against external catalog Default is
1.
- deltadist
Type: int
Delta distance in degrees to compare events against external catalog Default is
1.
- magtypes
Type: list:String
EEW magnitude types allowed to show in events dashboard Default is
[MVS,Mfd,Mfdr,Mfdl].
- latmin
Type: double
Minimum latitude allowed to show in events dashboard (value used in external catalog queries) Default is
5.5.
- latmax
Type: double
Maximum latitude allowed to show in events dashboard (value used in external catalog queries) Default is
19.0.
- lonmin
Type: double
Minimum longitude allowed to show in events dashboard (value used in external catalog queries) Default is
-94.0.
- lonmax
Type: double
Maximum longitude allowed to show in events dashboard (value used in external catalog queries) Default is
-81.5.
- latrmin
Type: double
Minimum latitude network region allowed to show in events dashboard (value used in external catalog queries) Default is
10.5.
- latrmax
Type: double
Maximum latitude network region allowed to show in events dashboard (value used in external catalog queries) Default is
14.6.
- lonrmin
Type: double
Minimum longitude network region allowed to show in events dashboard (value used in external catalog queries) Default is
-90.5.
- lonrmax
Type: double
Maximum longitude network region allowed to show in events dashboard (value used in external catalog queries) Default is
-87.1.
- jsonpath
Type: path
Path to query events information Default is
@DATADIR@/sceewv/events/.
- distint
Type: int
Distance in km to compute intensity using allen 2012 Default is
100.
- fpstatus
Type: bool
Show FP delay information in the histogram events dashboard Default is
False.
- deltadays
Type: int
Delta in days to select initial period to show in events dashboard Default is
30.
- minmag
Type: double
Minumum magnitude use in the initial range to show in events dashboard Default is
4.0.
- maxmag
Type: double
Maximum magnitude use in the initial range to show in events dashboard Default is
10.0.
- cmaplat
Type: double
Initial latitude to center map Default is
13.0.
- cmaplon
Type: double
Initial longitude to center map Default is
-89.0.
- zoomap
Type: int
Initial Zoom map 0 to 20 Default is
5.
- evejsonpath
Type: String
Path to query event envelope information Default is
@DATADIR@/sceewv/event/.
- phases
Type: list:String
List of phases for which to compute theoretical times Default is
[P,S,p,s].
- colors
Type: list:String
List of colors to show phases selected phases Default is
[#4D5656,#424949,#4D5656,#424949].
- model
Type: String
Velocity model used to compute theroic arrivals Default is
iasp91.
- fdsnwsclientwf
Type: String
Route to fdsnws service to query waveforms Default is
http://localhost:8080.
- envalias
Type: String
Route to fdsnws service to query waveforms Default is
sceewvenv.
- eveminmag
Type: int
Alias of sceewenv module to use in offline mode to compute envelope data Default is
4.
- evemaxmag
Type: int
Maximum magnitude use in the initial range to show in events dashboard Default is
9.9.
- evedeltadays
Type: int
Delta in days to select initial period to show in event dashboard Default is
30.
- timebefore
Type: int
Time in seconds before pick to extract wavefrom Default is
10.
- timeafter
Type: int
Time in seconds after pick to extract wavefrom Default is
180.
- maxdist
Type: int
Maximum distance in km to look for waveforms to compute envelope data Default is
250.
- invuri
Type: String
Database URI to query inventory to produce station list used in the envelope data plot Default is
mysql://sysop:sysop@localhost/seiscomp.